

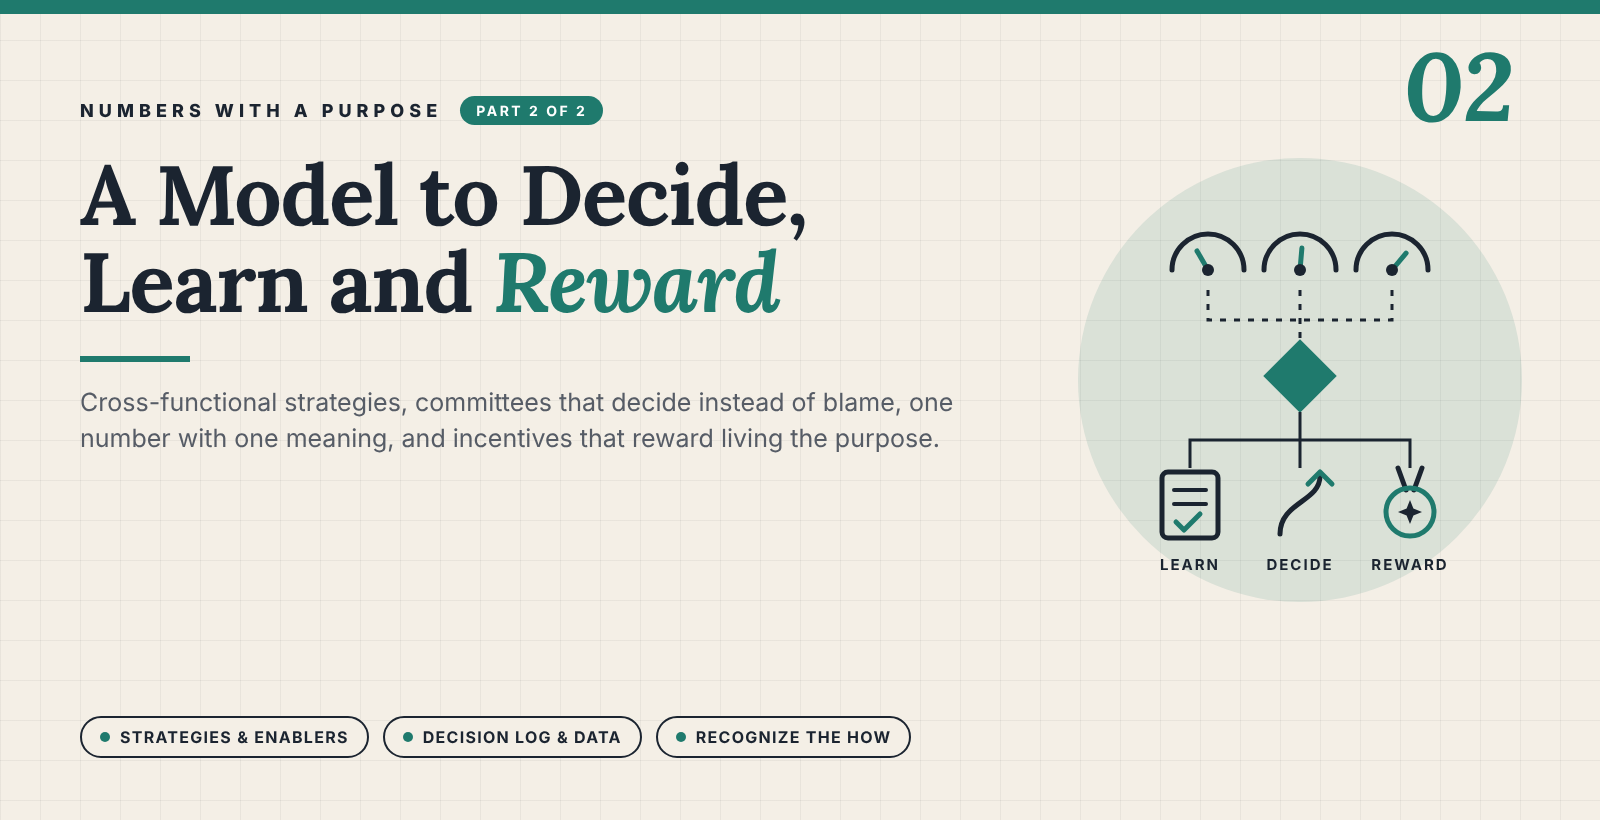
This is the second of two articles proposing a model to connect corporate purpose with the way companies measure, decide and reward. It places departmental plans as enablers of cross-functional business strategies, turns management committees into places to decide rather than to blame, and adds a decision log and basic data governance so the company learns from every change of strategy or metric. It closes with recognition and incentives: non-monetary recognition of the behaviors that live the purpose, monetary methods matched to business, leading and operating metrics, and a five-part rule backed by research on incentives. It is a model to be implemented and validated step by step, not a ready-made recipe.
Where we left off
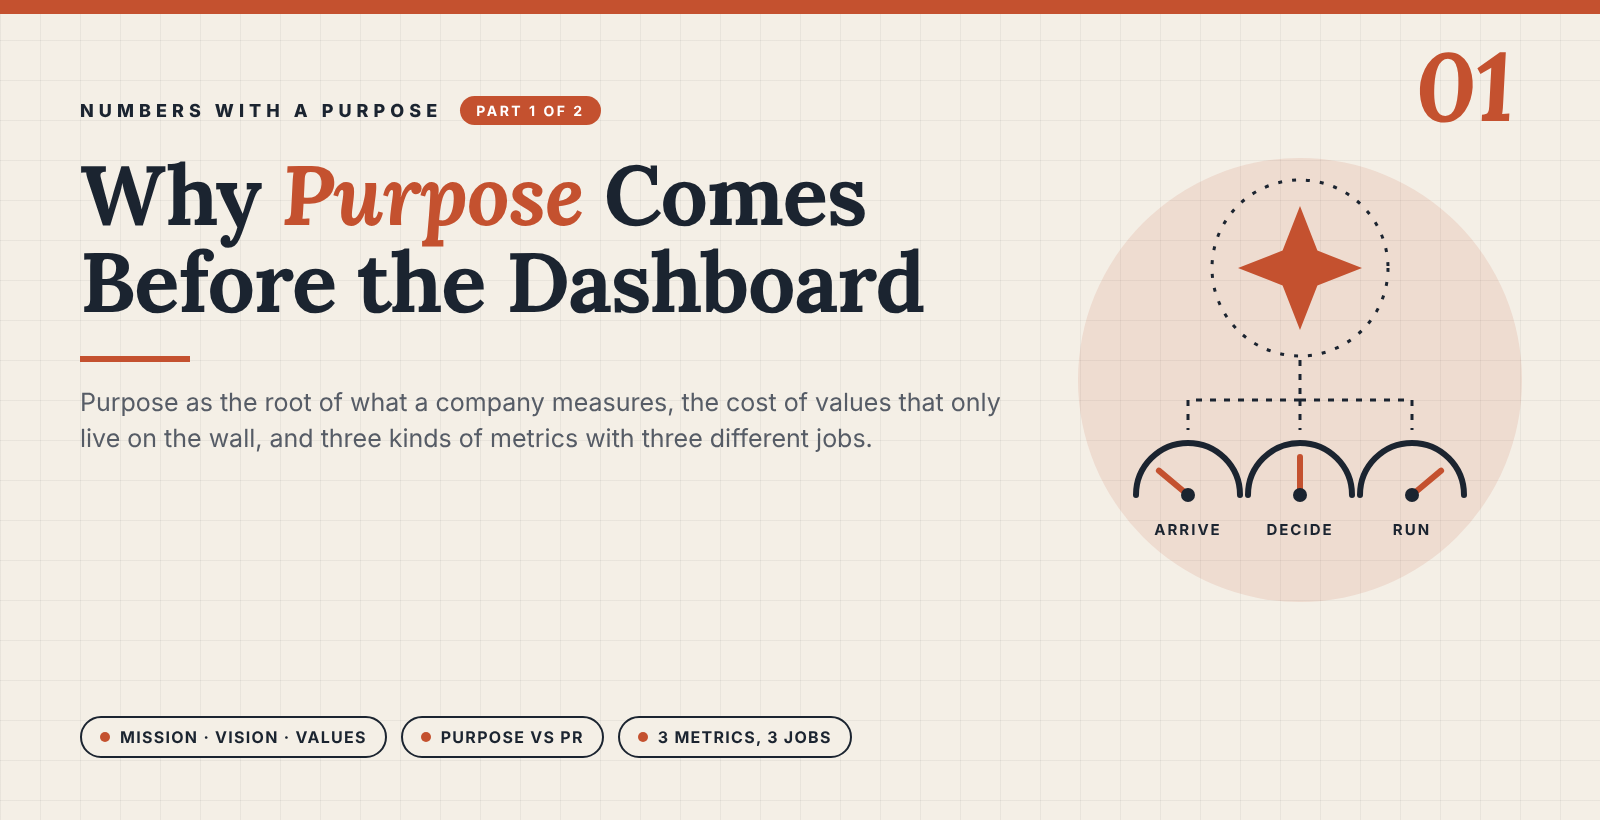
Part 1 argued that purpose is the umbrella of a mission (the contribution), a vision (the next port) and values (the frame), and that it only pays off when it turns into clarity. I then proposed sorting metrics by the question they answer: business metrics (did we arrive?), leading metrics (what do we decide?) and operating metrics (can we run?). A road trip from point A to point B, by Sunday at 3:00 p.m., showed them at work: when a traffic jam left me behind the checkpoint, the leading metric did not grade me as a driver; it told me to decide.
This second part takes the model from one driver to a whole company. Part 1 opened with a monthly committee where every indicator was green, including a 97% on-time-in-full (OTIF) delivery rate, while the customer was leaving. Here is how to change that meeting.
Business strategies first, departments as enablers
If leading metrics follow strategies, the next question is: whose strategies? The usual answer is a set of departmental plans: marketing has its strategy, sales has another, operations a third. Put them side by side and you often find they don’t add up to the business objective. Sometimes they pull against it.
I propose a clear order:
- Business strategies come first. They answer how the company will reach its business objectives. They belong to the company, not to an area.
- Many business strategies are cross-functional. Winning a new segment needs marketing, sales, operations and finance at the same time. Those areas are co-owners and jointly accountable for the strategy and its leading metrics.
- Departments have enabler strategies. Each area needs its own discipline and its own plans to operate: the capabilities, people, systems and processes the business strategies require. These enabler strategies are always subordinated to the business. They can never rank above the strategy they serve, nor block the company’s growth or its purpose, and every enabler should be able to say which business strategy it enables.
One of the CEOs (chief executive officers) interviewed by Carolyn Dewar, Scott Keller and Vikram Malhotra for their book CEO Excellence describes the role of the corporate center this way: “You [the business head] tell us what car you need to win the race, and we [the center] will bring it to you, built on a world-class platform” [1]. That is the enabler logic in one sentence. Robert Kaplan and David Norton, creators of the Balanced Scorecard, reached the same conclusion from the scorecard side: support units must be aligned with the corporate strategy, and “responsibility for this critical alignment lies with corporate headquarters” [2].
The same order applies to metrics. Every departmental KPI (key performance indicator) should hang from a business objective. Take OTIF. Which business objective does it serve? Customer satisfaction. Then OTIF is a means, not an end. If hitting OTIF stops adding to customer satisfaction, as in the opening scene where dates were moved to protect the indicator, the indicator gives way, not the customer.
Committees that decide, not blame
Leading metrics should be the main material of management committees, not to ask “who failed?” but “what do we decide?”. If a department did not deliver, the useful question is not “you committed and didn’t deliver” but “why not?”. Did you shift focus? Did a different priority come up? Is that priority the one the business needs to reach point B? That conversation aligns the team on data instead of on blame.
The best CEOs make this a habit. Hubert Joly, former CEO of Best Buy, kept the principle that “bad news needs to travel as fast, and probably faster, than good news” [1]. At DSM, Feike Sijbesma, then its CEO, set up a “Hall of Failures” where the company held “funerals for failed projects”, and trying and failing was honored “as long as lessons were learned and shared” [1].
The decision log
Changing leading metrics or strategies during the year is healthy. I would rather change them ten times to reach the objective than keep the same indicators all year, meet them, and drift away from the business. But change without a record has two risks: it looks like moving the goalposts, and the lesson is lost.
So every change goes into a decision log, a short entry that answers four questions borrowed from the US Army’s After Action Review [3]:
- What did we expect to happen?
- What actually happened?
- Why was there a difference? Execution, strategy or resources?
- What do we change, who owns it, and what will tell us it is working?
The Army designed the review to focus “on improving performance, not placing blame” [3]. Over time the log becomes something more valuable than any single decision: a company memory of what worked, what didn’t and why. A new team facing a similar market, a similar launch or a similar shortage starts from that memory instead of from zero.
Amazon offers a real example of changing a leading metric and learning from each change. When it expanded beyond books, it tracked “number of new detail pages created” as the input for selection. Teams added huge numbers of items, some with little demand, and sales did not follow. Over successive weekly reviews the metric became detail page views, then the share of page views where the product was in stock, and finally the share in stock and ready for two-day shipping [4]. Each version revealed something the previous one hid. Colin Bryar and Bill Carr call these “controllable input metrics”: the activities you directly control, constantly tested against the outputs they are supposed to move [4].
The log also handles the exceptions. When a departmental indicator conflicts with the business objective, like the OTIF that would be met by moving the customer’s date, the committee records the exception, the reason and the business objective it protects. The person is not penalized for the indicator, and the decision is visible to everyone.
Data governance: one number, one meaning
A decision log only works if everyone reads the numbers the same way. That is what data governance is for. The DAMA-DMBOK (Data Management Body of Knowledge, published by DAMA, the Data Management Association), the main reference for data management professionals, defines it as “the exercise of authority and control (planning, monitoring, and enforcement) over the management of data assets” [5]. For metrics, I would bring it down to five practices:
- One definition per metric. A metric dictionary states what each metric means, how it is calculated, where the data comes from, how often it is measured and whether it is a business, leading or operating metric. OTIF measured against the date the customer first asked for and OTIF measured against the last agreed date are two different metrics. Both can exist, but not under the same name.
- One owner per metric. In Amazon’s weekly business review, each owner must be able to answer, “How is this measured?”, and when the cause of a variation is unknown, they say so instead of making up an explanation [6].
- One source of truth. Finance, operations and sales read from the same data, not from their own spreadsheets, and finance can audit metrics independently to catch distortions [6].
- Versioned changes. When a leading metric is redefined, the old and the new definition stay in the log with the date and the reason, so no one compares a trend across two different definitions.
- Open by default. Open-book management, born in 1983 at Springfield Remanufacturing Corporation, showed that sharing the numbers with everyone, and teaching people to read them, lets each person see how their work moves the result [7]. Transparency is how a value becomes visible: if we say we trust our people, we show them the numbers.
With these five practices the decision log becomes a learning base: what we tried, what the data said, what we decided and why. The next team doesn’t repeat the mistake. It starts from a better leading metric, and from a number everyone understands the same way.
Recognize the how, pay the what
The goal is not a better bonus formula. The goal is for people to live the purpose. If everything is tied to a bonus, even a bonus tied to the right business objectives, the relationship becomes transactional: I do, I get paid, we’re even. And what is paid for becomes the only thing that counts.
Two classic studies show the risk. Uri Gneezy and Aldo Rustichini introduced a fine for parents who picked up their children late at ten day-care centers in Israel. Late pickups did not fall; they rose, and when the fine was removed they stayed high [8]. Once there was a price, being late stopped being a matter of respect and became a transaction. A meta-analysis of 128 experiments by Edward Deci, Richard Koestner and Richard Ryan found the same pattern from the other side: tangible rewards undermined intrinsic motivation, while positive verbal feedback strengthened it [9].
So, the proposal has two layers. Recognition, mostly non-monetary, is how the company shows which behaviors live the purpose. Money is how it shares the results the purpose produced.
Recognition that isn’t money
Recognition works best when it is specific and explains why. In a field experiment with more than 300 workers, an unannounced thank-you card signed by the head of the institute raised subsequent performance, most of all when it went to the top few performers, and mostly because the rest tried to catch up [10]. A few practices that tie recognition to the purpose:
- Say it out loud and say why. In a meeting, celebrate the person who made a decision of integrity that cost a sale, or who challenged the management team with conviction, if integrity and passion are among the values. Name the value the behavior represents. The “why” is what turns praise into culture.
- Put it in writing. A written recognition, even something as simple as a certificate, that names which part of the mission, vision or values the behavior lived. It lasts longer than the applause and tells others what the company really values.
- Leaders go first, especially when they are wrong. Showing vulnerability when you make a mistake, and correcting it in public, may be the strongest recognition of the values there is. Amy Edmondson found that teams that feel safe to take interpersonal risks learn more (they seek feedback, discuss errors, experiment) and that learning drives their performance [11]. Dewar, Keller and Malhotra sum it up: “For things to change, first I must change” [1]. Brad Smith lived it as CEO of Intuit: “We had to shift our mindsets,” he says, “to treat success and failure the same way—as an opportunity to learn.” He began to talk publicly about his own mistakes, posted his performance reviews on the glass window of his office, and emailed all employees his written review from the board with the three things he was working on, asking them to correct him when they saw him slip [1].
- Celebrate good decisions, not only good results. The committee that changed a leading metric in time, documented why and saved the objective deserves as much recognition as the team that exceeded its target.
Monetary incentives and where each one fits
Money still matters, and some methods fit the purpose better than others. The key is to match each method with the type of metric it should pay on.
Method What it pays on Metric type Fits the purpose when Watch out for Annual bonus on a company scorecard Company results, then an individual modifier Business (vision) The scorecard opens the pool and the how distributes it; 87% of S&P 500 (Standard & Poor’s index of 500 large US listed companies) companies with ESG (environmental, social and governance) goals already use weighted structures such as scorecards or modifiers [12] Becoming a sum of departmental KPIs Long-term incentives (e.g., performance shares) Multi-year results Business (vision) It rewards reaching the next port, not the quarter Short-term gaming near vesting dates Mission and ESG goals in incentive plans Contribution to customers, people, society Business (mission and values) Goals are measurable, like Ecolab’s water saved under its former CEO Doug Baker [1]; 74% of S&P 500 companies include ESG goals in incentive plans [12] Soft, discretionary targets that always pay out Profit sharing and open-book management Company profit, shared broadly Business (vision) People see the numbers and understand how they move them [7] Free-riding without a culture that supports it [13] Gainsharing (e.g., Scanlon plans) Savings from productivity, cost or quality gains Operating Gains are shared with the teams that produce them; in one retailer, Scanlon stores showed higher customer satisfaction and sales and lower turnover [14] Improving efficiency at the expense of the customer Team incentives Shared results of a team or a cross-functional strategy Business strategies Areas are co-owners of the same strategy; team pay raised productivity by about 14% in one garment plant [15] Unclear contribution within the team Clawback and malus Recovery of pay obtained by breaking the rules Values Results obtained against the values don’t count; since 2022 US listed companies must have clawback policies for restatements [16] Applying it only after a scandal No pay Leading metrics Leading Leading metrics are for deciding, as Google does with OKRs (objectives and key results) [17] and Amazon with its controllable inputs [4] Turning them into targets to hit Read the table by its columns, not its rows: business metrics can be paid, operating metrics can share efficiency gains, leading metrics are not paid, and values work as recognition when lived and as a veto when broken.
What the research says about paying on indicators
My hypothesis is that paying only on departmental or strategy indicators does not guarantee the business objective, nor that it was reached in line with the purpose. The research mostly supports it.
- Strong incentives on what is measurable crowd out what is not. Bengt Holmström and Paul Milgrom showed that “the desirability of providing incentives for any one activity decreases with the difficulty of measuring performance” in the competing activities, such as team work “where their individual contributions are poorly measured” [18]. Holmström shared the 2016 Nobel Prize in economics for this line of work.
- Every indicator is a distorted copy of the true objective. George Baker describes the value of a measure in two dimensions: distortion, how far it is from what the company really wants, and risk, how much noise outside the person’s control it carries [19]. The OTIF that improves by moving dates is pure distortion.
- Hard goals tied to pay invite shortcuts. Goals Gone Wild documents unethical behavior, neglect of everything outside the goal and weakened culture; its cases include Sears auto mechanics overcharging customers and the Ford Pinto [20]. Wells Fargo, whose employees opened about 2 million possibly unauthorized accounts to hit sales targets, is the same story at bank scale [21][22]. And when pay hangs on the target, Dewar, Keller and Malhotra observe, managers “sandbag”, setting expectations low so they are sure to beat them [1].
- Behavior must count. Jack Welch called “the manager who doesn’t share the values, but delivers the numbers” the toughest call of all, because such people can “destroy the open, informal, trust-based culture” [23]. Ed Breen, who led DuPont as CEO, put it more briefly: “Grade behaviors first—and after that, grade results” [1]. Robbie Kellman Baxter adds that incentives must follow the model: a salesperson paid for closing big deals has to move to a “farming” model that rewards relationships over time [24].
The refinement: paying only on the business outcome has its own trap, Baker’s risk [19]. Results include luck. Pay purely on them and you may punish a good decision that met bad luck and reward a bad one that met good luck. That is why the how is not an afterthought: it separates contribution from fortune.
The rule
- Recognize the how, always. Behaviors that live the mission, vision and values are recognized openly, with the why, and mostly without money.
- The business objective opens the pool. If the company didn’t reach its business objectives, there is no bonus for having met a leading metric. Meeting an indicator that did not get us to point B is not an achievement.
- The how distributes it. Within the pool, people are differentiated by how they contributed: collaboration across areas, quality of decisions, speed in adjusting when the leading metrics turned red. Because this is a judgment, it needs observable behaviors and calibration between evaluators, and it feeds each person’s development, not only their pay.
- Leading metrics are neither paid nor penalized on their own. What is expected is that people use them to decide and adjust, and record the change in the decision log.
- Values are a veto. A result obtained by breaking the values doesn’t count and can be reversed, as Wells Fargo’s board eventually did with about $69 million of its former CEO’s pay [22]. Better to set the rule up front than to discover it in a regulator’s press release.
The model at a glance
Element Question it answers Changes? Measured by Used for Linked to pay? Purpose Why does all of this matter? No The three below, together Direction and meaning Through the three below Mission What do we contribute, and to whom? Rarely Contribution metrics (e.g., water saved by clients) Testing strategy and incentives against it Yes, as a business metric Vision Where do we want to be? Yes, once reached 3 to 4 business metrics Judging whether the business arrived Opens the bonus pool Values How will and won’t we behave? No Perceived integrity, incidents, 360 feedback Guardrails Recognition when lived; veto and clawback when broken Business strategies How will we get there? Yes, when the data says so Leading metrics: planned actions and checkpoints Deciding: pivot, refocus, reallocate No; exceptions go to the decision log Departmental enablers What capabilities does each strategy need? Yes, with the strategy Leading and operating metrics Delivering the capabilities Through the how Operations Can we run? Adjusted for efficiency Operating metrics Hygiene: capacity and efficiency Rarely Back to the committee
Let’s return to the monthly committee where everything was green and the customer was leaving.
With this model the meeting opens differently. First, the three or four business metrics: are customers happier, is the contribution happening, are we behaving as we said? Then the leading metrics of the cross-functional strategies, read as material for decisions: the OTIF went up by moving dates, so the exception is logged, the indicator is redefined and the strategy adjusted. The operating metrics get five minutes, because they are hygiene. Nobody gets a bonus for a green indicator that left the customer behind, and someone is recognized, out loud and with the reason, for the decision that put the customer first.
None of this is new in its parts. Jim Collins and Jerry Porras separated what stays from what moves; Kaplan and Norton paired outcomes with drivers; Google separated OKRs from evaluation; Steven Kerr warned us fifty years ago about rewarding A while hoping for B (all discussed in Part 1). What I propose is to put the pieces in one order: purpose first, then three kinds of metrics with three different uses, a data discipline so everyone reads the same number the same way, and a way of recognizing and paying that rewards living the purpose, not just hitting the indicator.
It is a model, not a recipe. It should be implemented and validated step by step, in each company’s reality, starting with the simplest question: what is each of our metrics really for?
Sources
- Dewar, C., Keller, S. & Malhotra, V. (2022). CEO Excellence: The Six Mindsets That Distinguish the Best Leaders from the Rest. Scribner. Quotes taken from the author’s highlights (Kindle edition); the Ecolab figures are as reported in the book (p. 206). McKinsey authors. Quotes from CEOs (Hubert Joly, Feike Sijbesma, Brad Smith, Ed Breen) are as reported in the book’s interviews.
- Kaplan, R. & Norton, D. (2006). Alignment: Using the Balanced Scorecard to Create Corporate Synergies. Harvard Business School Press. Publisher’s description only.
- After Action Review Guide, based on US Army Training Circular 25-20 (1993), A Leader’s Guide to After-Action Reviews. Secondary guide.
- Bryar, C. & Carr, B. (2021). Working Backwards. St. Martin’s Press. Chapter 6 read via an excerpt in Holistics’ newsletter, a BI (business intelligence) vendor.
- DAMA (Data Management Association) International. DAMA-DMBOK: Data Management Body of Knowledge. Definition read via Data Quality Pro’s catalogue of definitions.
- Chin, C. “The Amazon Weekly Business Review”. Commoncog; secondary, credited to Colin Bryar.
- ICAEW (Institute of Chartered Accountants in England and Wales). What is open-book management?. Professional accounting body; on Jack Stack and SRC’s (Springfield Remanufacturing Corporation) Great Game of Business.
- Gneezy, U. & Rustichini, A. (2000). “A Fine Is a Price”. Journal of Legal Studies. Field experiment, 10 day-care centres in Haifa.
- Deci, E., Koestner, R. & Ryan, R. (1999). “A Meta-Analytic Review of Experiments Examining the Effects of Extrinsic Rewards on Intrinsic Motivation”. Psychological Bulletin. 128 studies; mostly lab settings.
- Bradler, C., Dur, R., Neckermann, S. & Non, A. (2016). “Employee Recognition and Performance: A Field Experiment”. Management Science. Abstract; one short data-entry job.
- Edmondson, A. (1999). “Psychological Safety and Learning Behavior in Work Teams”. Administrative Science Quarterly. 51 teams in one manufacturer; university-hosted copy.
- Semler Brossy (2024). “2024 ESG + Incentives Report”. Compensation consultancy, via the Harvard Law School Forum. S&P 500 proxies.
- Blasi, J., Freeman, R., Mackin, C. & Kruse, D. (2008). “Creating a Bigger Pie?”. NBER (National Bureau of Economic Research) Working Paper 14230. Firms not randomly selected.
- Scott, K. D., Floyd, J., Benson, P. & Bishop, J. (2002). “The Impact of the Scanlon Plan on Retail Store Performance”. WorldatWork Journal. Read via e-reward’s summary; six stores at one retailer.
- Hamilton, B., Nickerson, J. & Owan, H. (2003). “Team Incentives and Worker Heterogeneity”. Journal of Political Economy. Abstract; one garment plant.
- Simpson Thacher (2022). “SEC Releases Final Rules Regarding Clawback Policies for Public Issuers”. Law-firm summary of SEC (US Securities and Exchange Commission) Rule 10D-1, via the Harvard Law School Forum.
- Google re:Work. Guide: Set goals with OKRs. Google, primary source.
- Holmström, B. & Milgrom, P. (1991). “Multitask Principal-Agent Analyses”. Journal of Law, Economics, & Organization. Theoretical model; third-party copy. Nobel: NBER note on the 2016 prize.
- Baker, G. (2002). “Distortion and Risk in Optimal Incentive Contracts”. Journal of Human Resources. Abstract only.
- Ordóñez, L., Schweitzer, M., Galinsky, A. & Bazerman, M. (2009). “Goals Gone Wild”. Academy of Management Perspectives. Read via HBS (Harvard Business School) Working Knowledge.
- Consumer Financial Protection Bureau (2016). CFPB fines Wells Fargo $100 million for widespread illegal practice of secretly opening unauthorized accounts. US regulator, primary source.
- Wells Fargo & Company (2017). Independent Directors of the Board release findings of investigation. SEC filing, form DEFA14A (additional proxy materials); the company’s own board report.
- General Electric (2001). Annual Report 2000, letter to shareholders by Jack Welch. Company primary source, university-hosted copy.
- Baxter, R. K. “Culture: The Biggest Challenge in Getting the Subscription Model Right”. Published by Zuora, a subscription-billing vendor. The author wrote The Membership Economy (2015).

Leave a Reply