

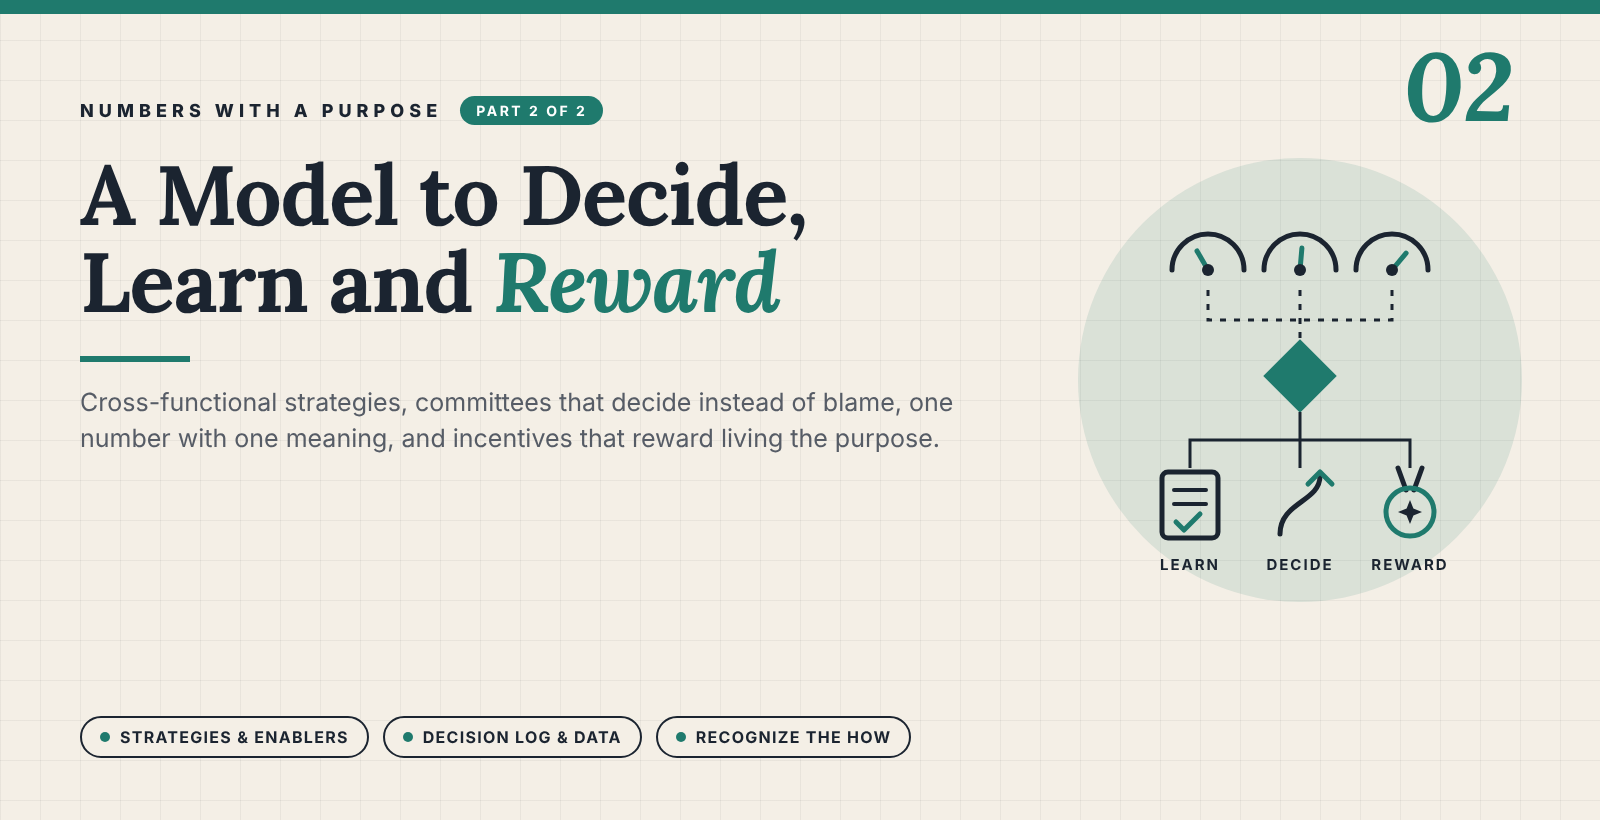
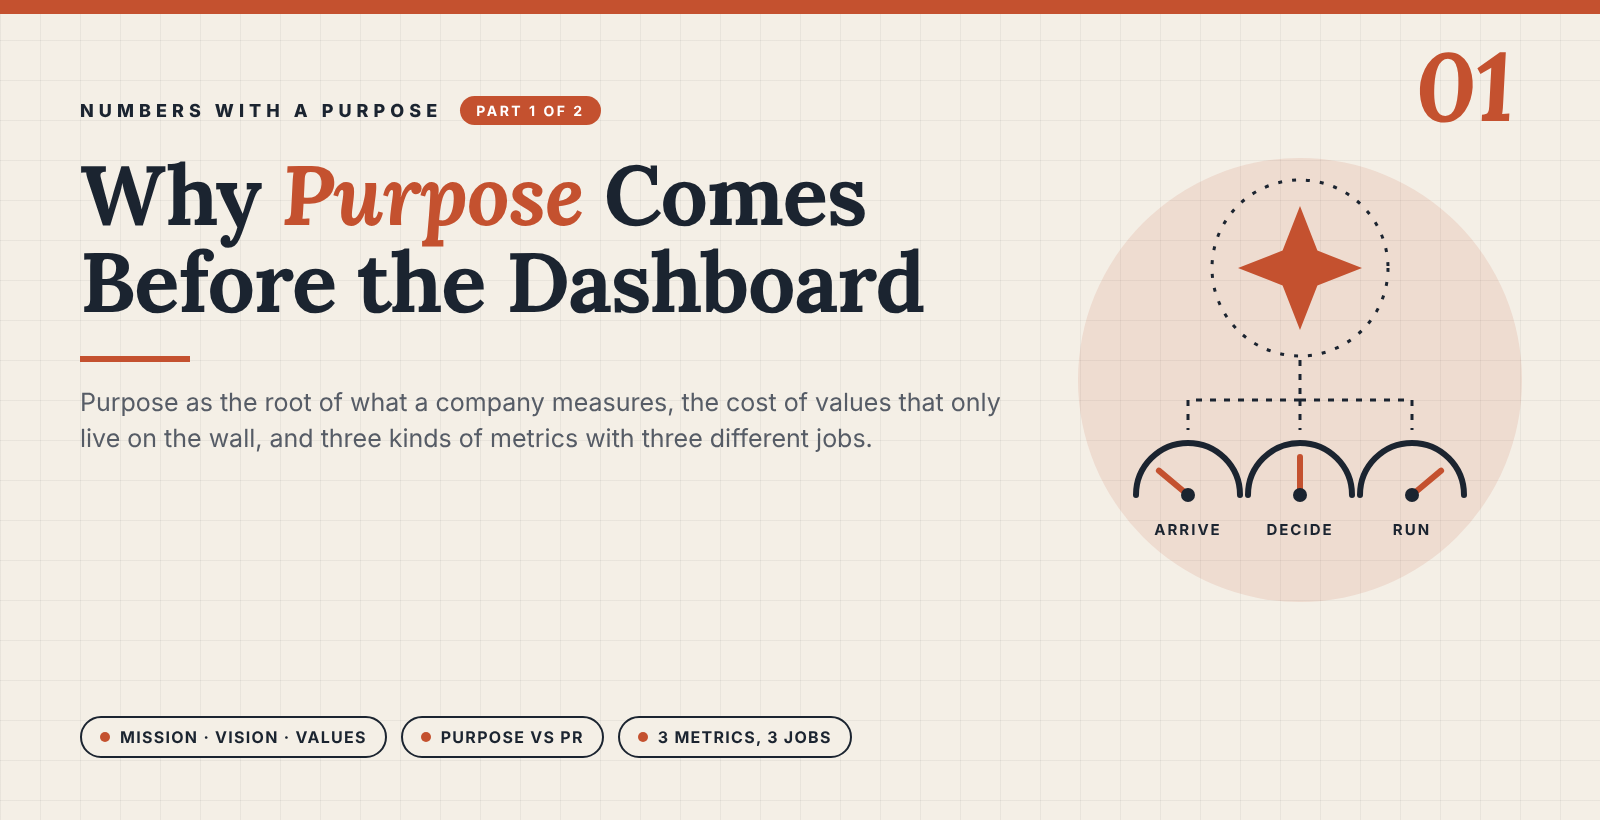
This is the first of two articles proposing a model to connect corporate purpose with the way companies measure, decide and reward. Purpose is the umbrella of three parts: a mission (the contribution, which rarely changes), a vision (the next port, renewed once reached) and values (the behaviours that frame the journey). Microsoft’s change of mission shows why the distinction matters. Research on hundreds of companies, and the cases of Enron, Wells Fargo and Volkswagen, show that advertised values and a vague sense of purpose don’t move performance on their own; purpose pays when it turns into clarity. After mapping the main measurement frameworks, from MBO (management by objectives) to OKRs (objectives and key results), the article proposes three kinds of metrics with three different uses: business metrics (did we arrive?), leading metrics (what do we decide?) and operating metrics (can we run?), illustrated by a road trip from A to B. Part 2 takes the model to strategies, committees, data and incentives. It is a model to be implemented and validated step by step, not a ready-made recipe.
Everyone hit their number
Picture the monthly committee of a mid-sized company. Operations reports an on-time-in-full (OTIF) rate of 97%, above target. Sales hit its volume. Finance kept costs under budget. Marketing launched every campaign on time. Green across the board.
Then someone asks the only question that matters: are our customers happier than last quarter? The room goes quiet. Satisfaction is down and two key accounts are shopping around. When you dig, part of that 97% was built by calling customers to move their delivery dates. The deliveries were “on time” against a date the customer never wanted.
Nobody lied. Everyone did exactly what they were measured and paid to do. That is the problem these two articles are about.
Across these two articles I want to argue two things. First, that purpose (mission, vision and values) is not a poster on the wall but the root that tells a company what to measure. Second, that metrics have different jobs. Some tell you whether you arrived, some help you decide along the way, and some tell you whether the car can run at all. Mix those jobs up and a company turns green dashboards into silos.
What I mean by purpose
Vision, mission, values, purpose: we use them almost interchangeably. Carolyn Dewar, Scott Keller and Vikram Malhotra, who studied top-performing CEOs (chief executive officers) for their book CEO Excellence, note that many leaders “see the concepts of vision, mission, and purpose as interchangeable” [1]. So let me set my terms before going further.
For me, purpose is the umbrella. It is what you pursue forever and never quite reach: what Jim Collins and Jerry Porras call “a guiding star on the horizon” [2]. It has three parts:
- Mission, the contribution. Why the business deserves to exist: what it adds to its customers, its people, its owners and the community where it operates. It rarely changes.
- Vision, the next port. A concrete, long-term destination the company can reach. Once it gets there, it has to draw the next one.
- Values, the frame. The behaviors we expect and accept along the way, including when they cost us something.
What it answers Does it change? Collins & Porras call it Purpose Why all of this matters No: pursued, never reached The whole “vision” Mission What we contribute, and to whom Rarely Core purpose Vision Where we want to be in 10 to 20 years Yes, once reached Envisioned future (BHAG, Big Hairy Audacious Goal) Values How we will and won’t behave No Core values Collins and Porras draw the same building with different labels [2]. They call the whole structure “vision”: core values and core purpose are the fixed part, and a Big Hairy Audacious Goal (BHAG) of 10 to 30 years is the moving part. Their rule of thumb is “if it’s not core, it’s up for change.” The labels matter less than that split between what stays and what moves.
When a mission is really a vision
Microsoft shows why the split matters. For decades its mission was a PC (personal computer) on every desk and in every home. In 2015 Satya Nadella told partners the company had achieved it together, and replaced it with “empowering every person and every organization on the planet to achieve more” [3].
Read the two side by side. The first describes a state of the world that can be reached and counted: it is a vision. The second describes a contribution that never ends: it is a mission. Microsoft did not change its mission so much as discover that it never had one. I would argue that is why the old statement ran out of road once the PCs were on the desks.
Who the purpose speaks to
The split also shows who a company is talking to. Dewar, Keller and Malhotra describe five sources of meaning at work: the self (development, rewards, freedom to act), our colleagues (belonging), the company (industry leadership), the customer (making their life better) and society (making the world better) [1].
Four of the five are about contribution: that is the mission. Only one, being the best company in the industry, belongs to the vision. A company that only talks about where it wants to go is speaking to one source of meaning out of five.
The values make the rest believable. As Satya Nadella, CEO of Microsoft, puts it, we “trust people who think, say, and do the same thing” [1]. If passion is one of my values but I avoid decisions, act out of fear and follow competitors, nobody believes the word on the wall. Collins and Porras set a demanding test: keep a value only if you would hold it even when it becomes a competitive disadvantage [2].
When purpose is PR
Some companies write their purpose the way they write a press release: what would customers, investors or owners like to hear? We are sustainable. We care for our community. We treat our people well. The words are easy. The evidence says they do not move the needle on their own.
Claiming values is free. Luigi Guiso, Paola Sapienza and Luigi Zingales studied the S&P 500 (Standard & Poor’s index of 500 large US listed companies). About 85% of those companies have a section on corporate culture on their website, and around 70% list integrity among their values [4]. How prominently a company advertises its values shows no relation with its performance. What does relate is how employees perceive management’s integrity, measured through the Great Place to Work survey. A one-standard-deviation increase in perceived integrity goes with higher valuation, profitability and appeal to job applicants [4].
Patrick Lencioni found the same pattern among the Fortune 100: about 80% publicly tout their values, and 55% claim integrity [5]. His sharpest example is Enron, whose 2000 annual report listed “Communication. Respect. Integrity. Excellence.” [5]
Two cases where the poster and the practice split
Wells Fargo. In 2016 the US Consumer Financial Protection Bureau (CFPB) fined the bank $100 million. Its own analysis found about 2 million deposit and credit card accounts that may have been opened without customers’ authorization. In the regulator’s words, employees opened them “to hit sales targets and receive bonuses” [6]. The board’s own investigation named the root cause as the “distortion of the Community Bank’s sales culture and performance management system”, with sales goals that leaders failed to see were “too high and becoming increasingly untenable” [7]. The board clawed back or cancelled about $69 million of the former CEO’s pay [7]. A cross-selling goal became the business, and the customer became the input.
Volkswagen. In 2014 the group said it wanted to be “the most successful, fascinating and sustainable automaker in the world by 2018”, alongside a target of more than 10 million vehicles a year [8]. The sustainability ambition came with no measurable environmental target; the volume ambition did. In September 2015 the US Environmental Protection Agency (EPA) issued a notice of violation. Software in about 590,000 diesel vehicles in the US turned emissions controls fully on only during tests; on the road, the 2.0-litre cars emitted up to 40 times the permitted nitrogen oxides [9]. The criminal penalty alone was $2.8 billion [9]. When the vision has numbers and the mission has adjectives, the numbers win.
Purpose pays only when it becomes clarity
Claudine Gartenberg, Andrea Prat and George Serafeim analyzed survey answers from nearly 500,000 employees in about 500 companies [10]. A strong sense of purpose on its own showed no relation to financial performance. It paid off only when it came with clarity: employees who believe management has a clear direction and know what they need to do. Those firms showed higher return on assets and stock returns, and the effect came almost entirely from middle managers [10].
That is the bridge to the rest of this article. Purpose becomes performance when it turns into clarity, and clarity is what metrics give when they are used well. Dewar, Keller and Malhotra put it bluntly: when resource decisions don’t line up with the vision and strategy, “the latter become just hollow words” [1].
The first to notice the gap are not the customers but the employees. People who see that the company does not live what it writes stop working for the purpose and start working for their own indicator: the one they are paid on. That is where silos begin.
Silos: rewarding A while hoping for B
When nothing connects people to a common end, each area does what it is asked and nothing more. I hit my numbers. It’s not my area. I sent the email, so there is proof I did my part. Decisions that belong to everyone end up belonging to no one, and the company spends its energy defending positions instead of moving forward.
Steven Kerr described this mechanism in 1975, in one of the most quoted papers in management: organizations often reward one behavior while hoping for another [11]. His sports example fits any company. Coaches preach teamwork, yet “rewards are distributed according to individual performance”, so “it therefore is rational for players to think of themselves first, and the team second” [11]. Silos are not a character flaw. They are a rational answer to the way we measure and pay.
The best CEOs studied by Dewar, Keller and Malhotra work against this deliberately. At Aon, under CEO Greg Case, leaders are “explicitly expected to spend a day a week helping colleagues outside of their own area to succeed” [1]. The authors also found that the best CEOs insist the top team is every member’s “first team”: you sit there to represent the company to your function, not your function to the company [1].
A company can grow without a clear purpose. It can even post good results. But it grows with more friction, more internal barriers, more turnover and more short-term, tactical strategies, because nothing holds the pieces together. The cost doesn’t show in a single quarter. It shows in the leaps the company could have made and didn’t.
The measurement landscape
Before proposing anything, it is worth looking at what already exists. Businesses have been building measurement systems for seventy years, and the main ones share more than their acronyms suggest.
Framework Where it comes from What it asks you to define What it is best at MBO, Management by Objectives Peter Drucker, 1950s [12] Objectives agreed between manager and employee Linking individual work to company goals KPIs, Key Performance Indicators Generic; refined by David Parmenter [13] A few critical measures, separated from result indicators Telling what is critical from what is merely reported Balanced Scorecard Robert Kaplan and David Norton, 1990s [14] Financial, customer, process and learning perspectives; outcomes and drivers Balancing lagging results with leading drivers Hoshin Kanri (policy deployment) Japan; popularized by Toyota in the 1960s[15] Breakthrough objectives, annual objectives, priorities, targets, owners Cascading strategy through negotiation (“catchball”) OGSM Attributed to Procter & Gamble; origin unclear [16] Objective, Goals, Strategies, Measures Putting a whole plan on one page OKRs, Objectives and Key Results Andy Grove at Intel; Google from 1999 [12][17] 3 to 5 ambitious objectives, about 3 key results each Focus and stretch, reviewed often 4DX, The 4 Disciplines of Execution FranklinCovey [18] One or two “wildly important goals”; lag and lead measures Turning goals into weekly actions North Star Metric Product analytics (Amplitude) [19] One metric of customer value plus its inputs Aligning product teams around one number ExO (Exponential Organization) dashboards Salim Ismail, Exponential Organizations [20] A Massive Transformative Purpose (MTP), OKRs and real-time dashboards Speed: deciding on live data, not monthly reports Read across the rows and three agreements stand out.
- Few priorities. Google recommends “just three to five objectives”, because more lead to “over-extended teams and a diffusion of effort” [17]. 4DX goes further, to one or two.
- A line from purpose to the daily task. OGSM, Hoshin Kanri and the Balanced Scorecard all draw it explicitly. Ismail’s ExOs start from a transformative purpose and translate it into OKRs [20].
- Outcomes are not enough. Kaplan and Norton pair outcome measures with “performance drivers” that “provide early indications about whether the strategy is being implemented successfully” [14]. OGSM separates Goals (the results) from Measures (progress on each strategy) [16]. 4DX separates lag measures from lead measures that are predictive and that the team can influence directly [18].
Where they differ, or stay silent, is on what each number is used for. Google is one of the few to say it outright: “OKRs are not synonymous with performance evaluation” [17]. Most companies take whatever framework they adopt and use every number in it the same way: to grade people. That is the gap my proposal tries to close.
Three questions, three metrics
I propose to sort metrics not by department or framework, but by the question each one answers and the use it should have.
Business metrics Leading metrics Operating metrics The question Did we arrive? Are we on track, and what do we change? Can we run? Tied to Vision, mission and values The strategies chosen to reach the vision The resources the strategies consume What it is An outcome The result of an action we decided to take, or a checkpoint on the way A condition: capacity, availability, efficiency How often Quarterly to yearly Daily to monthly Continuous to weekly Its use To judge whether the business met its objective To decide: pivot, refocus, reallocate To keep the operation efficient and safe Not for Micromanaging Grading or penalizing people Predicting success Closest relatives KRIs (key result indicators) [13], lagging outcomes [14], OGSM Goals [16], objectives in OKRs [17] Performance drivers [14], OGSM Measures [16], 4DX lead measures [18], Hoshin targets [15] Process and operational KPIs [13] Business metrics are few (three or four at most) and say whether the company reached what it set out to reach. They are not only financial. If the purpose has three parts, the business metrics must cover the three:
- Vision: revenue, share, growth, value: whether we reached the next port.
- Mission: whether the contribution is happening. Under its former CEO Doug Baker, Ecolab made how much water its clients save each year one of its primary metrics: 206 billion gallons against a 2030 target of 300 billion, as Dewar, Keller and Malhotra report [1]. The authors add that the best CEOs “test their strategy, products and services, supply chain, performance metrics, and incentives” against their purpose [1].
- Values: the hardest, because values are behavior. Measure them the way Guiso and colleagues did: through what employees perceive, not what the company claims [4]. Add incident and ethics-line data, exit interviews and 360 feedback. And act on it. As Sandy Cutler, former CEO of Eaton, warns, “employee surveys only work if the results are followed up on vigorously” [1].
Why measure values at all? Because a values breach rarely shows in the short-term results. The salesperson who lies or bends the rules may be your best performer this quarter. Measured only on vision metrics, the company rewards the very behavior that will hurt it years later.
Leading metrics are the core of the proposal and the least used. They track whether what we planned is happening, so we can decide in time. When a leading metric goes off track there are three possible readings, and only one is about the person:
- The action wasn’t executed. That is a performance conversation.
- The strategy was wrong, or the market moved. That is a strategy decision.
- The resources were not enough: people, capacity, budget. That is an allocation decision.
A company that reads every red leading metric as reason number one never learns about reasons two and three.
Operating metrics tell you whether you have what you need to operate: machines available, inventory, staffing, system uptime. They don’t tell you whether you will succeed. They tell you that you won’t fail for lack of the basics. They are hygiene.
The road trip from A to B
A simple analogy puts the three types in place. I have to get from point A to point B by Sunday at 3:00 p.m., not before and not after, with a budget of $1,000.
That is the objective, but it is not all of me. Along the way I want to help whoever needs it, and there are things I won’t do to arrive on time: break the speed limit, put anyone at risk, cut corners. None of that is the objective. All of it shapes how I will reach it.
Choosing the strategy. I could walk, drive or take the train. Walking would let me help many people, but I would arrive a week late: it fails the objective. The train is fast but rigid. The car gives me flexibility to change route, stop, and help someone on the road. I choose the car. The purpose filtered the options before any number did.
The metrics of the trip:
Type In the trip What it tells me Business: vision At point B, Sunday 3:00 p.m., within $1,000 Did I arrive? Business: mission and values Help given on the road; zero speeding tickets; nobody put at risk Did I arrive the way I said I would? Leading: planned actions Leave Friday at 7:00 a.m. on the toll road; refuel at the planned stop at km 300 Am I doing what my strategy requires? Leading: checkpoints Halfway city by Friday 3:00 p.m. Is the plan producing the progress it should? Operating Fuel level, tire pressure, oil Can the car run? Two refinements matter here. First, the fuel level is not a leading metric: it is a condition, an operating metric. Having fuel doesn’t guarantee I arrive on Sunday at 3:00 p.m.; having none guarantees I don’t. The leading metric is the decision I made and can control: to refuel at a planned point. That is how 4DX describes lead measures: predictive of the result and directly influenceable by the team [18].
Second, I keep the checkpoint next to the planned actions. Actions tell me whether I am doing what I said; checkpoints tell me whether doing it is working. Dewar, Keller and Malhotra describe the best CEOs managing “by milestones (not annual budgets)”, where “each milestone forces periodic debate over whether to continue or not” [1].
The decision. I leave on time, on the planned road, and refuel at km 300. A traffic jam holds me for hours. By Friday at 3:00 p.m. I am two cities short of the checkpoint. The leading metric just did its job: it is not telling me I am a bad driver; it is telling me to decide. I can take another route. I can park and take the train for the last stretch. I can drive faster, and that is where values come in: not above the speed limit, not at the expense of my health.
The objective did not move. The strategy did. Many roads lead to Rome; what matters is getting to Rome, on time and in the way I said I would.
What comes next
The objective is clear, the three kinds of metrics are on the dashboard and the car is on the road. But a company is not one driver. Who owns the strategy when marketing, sales and operations each have a plan of their own? Who decides when a leading metric turns red, and how does the company remember what it learned? And the question that decides whether any of this survives contact with reality: what do we recognize, and what do we pay for? If the answer is “the indicator”, we are back at the committee where every number was green and the customer was walking out the door. That is Part 2.
Sources
- Dewar, C., Keller, S. & Malhotra, V. (2022). CEO Excellence: The Six Mindsets That Distinguish the Best Leaders from the Rest. Scribner. Quotes taken from the author’s highlights (Kindle edition); the Ecolab figures are as reported in the book (p. 206). McKinsey authors. Quotes from CEOs (Satya Nadella, Sandy Cutler) are as reported in the book’s interviews.
- Collins, J. & Porras, J. (1996). “Building Your Company’s Vision”. Harvard Business Review. University-hosted copy.
- Nadella, S. (2015). Worldwide Partner Conference keynote. Microsoft, primary source.
- Guiso, L., Sapienza, P. & Zingales, L. (2015). “The Value of Corporate Culture”. Journal of Financial Economics. Read via the authors’ summary at the Harvard Law School Forum on Corporate Governance; working paper at NBER (National Bureau of Economic Research). Correlational, US firms.
- Lencioni, P. (2002). “Make Your Values Mean Something”. Harvard Business Review. Copy hosted by the author’s consulting firm, The Table Group.
- Consumer Financial Protection Bureau (2016). CFPB fines Wells Fargo $100 million for widespread illegal practice of secretly opening unauthorized accounts. US regulator, primary source.
- Wells Fargo & Company (2017). Independent Directors of the Board release findings of investigation. SEC (US Securities and Exchange Commission) filing, form DEFA14A (additional proxy materials); the company’s own board report.
- Volkswagen AG (2015). Annual Report 2014: Goals and Strategies. Company primary source.
- US Environmental Protection Agency. Learn About Volkswagen Violations. US regulator, primary source.
- Gartenberg, C., Prat, A. & Serafeim, G. (2019). “Corporate Purpose and Financial Performance”. Organization Science. Read via IESE Insight’s summary (IESE Business School). Survey-based and correlational.
- Kerr, S. (1975). “On the Folly of Rewarding A, While Hoping for B”. Academy of Management Journal (1995 reprint). University-hosted copy.
- What Matters. The OKR Origin Story. Site of John Doerr, who brought OKRs to Google; secondary on Drucker’s MBO.
- Parmenter, D. (2015). Key Performance Indicators, 3rd ed. Wiley. Only the preface and contents were read.
- Kaplan, R. & Norton, D. (1996). “Linking the Balanced Scorecard to Strategy”. California Management Review; read via the MAAW (Management And Accounting Web) summary.
- Rework. Hoshin Kanri: Strategy Deployment With the X-Matrix. Secondary source from a software vendor’s library.
- Wikipedia. OGSM. Secondary; the Procter & Gamble (P&G) origin is not fully verified.
- Google re:Work. Guide: Set goals with OKRs. Google, primary source.
- McChesney, C., Covey, S. & Huling, J. (2012). The 4 Disciplines of Execution. FranklinCovey / Free Press. Read via a secondary concept summary.
- Amplitude. North Star Playbook. Vendor (product analytics).
- Ismail, S., Malone, M. & van Geest, Y. (2014). Exponential Organizations. Diversion Books. Concepts read via the OpenExO glossary, the authors’ community.

Leave a Reply